As a human rights screening body, the Commission reviews every complaint we receive. We can only accept complaints that meet the requirements outlined in the Canadian Human Rights Act. We help people resolve their issues in the quickest, most confidential, and fairest way possible. This can involve mediation, referral to another organization, or referral to the Canadian Human Rights Tribunal.
Proportion of accepted complaints by grounds of discrimination
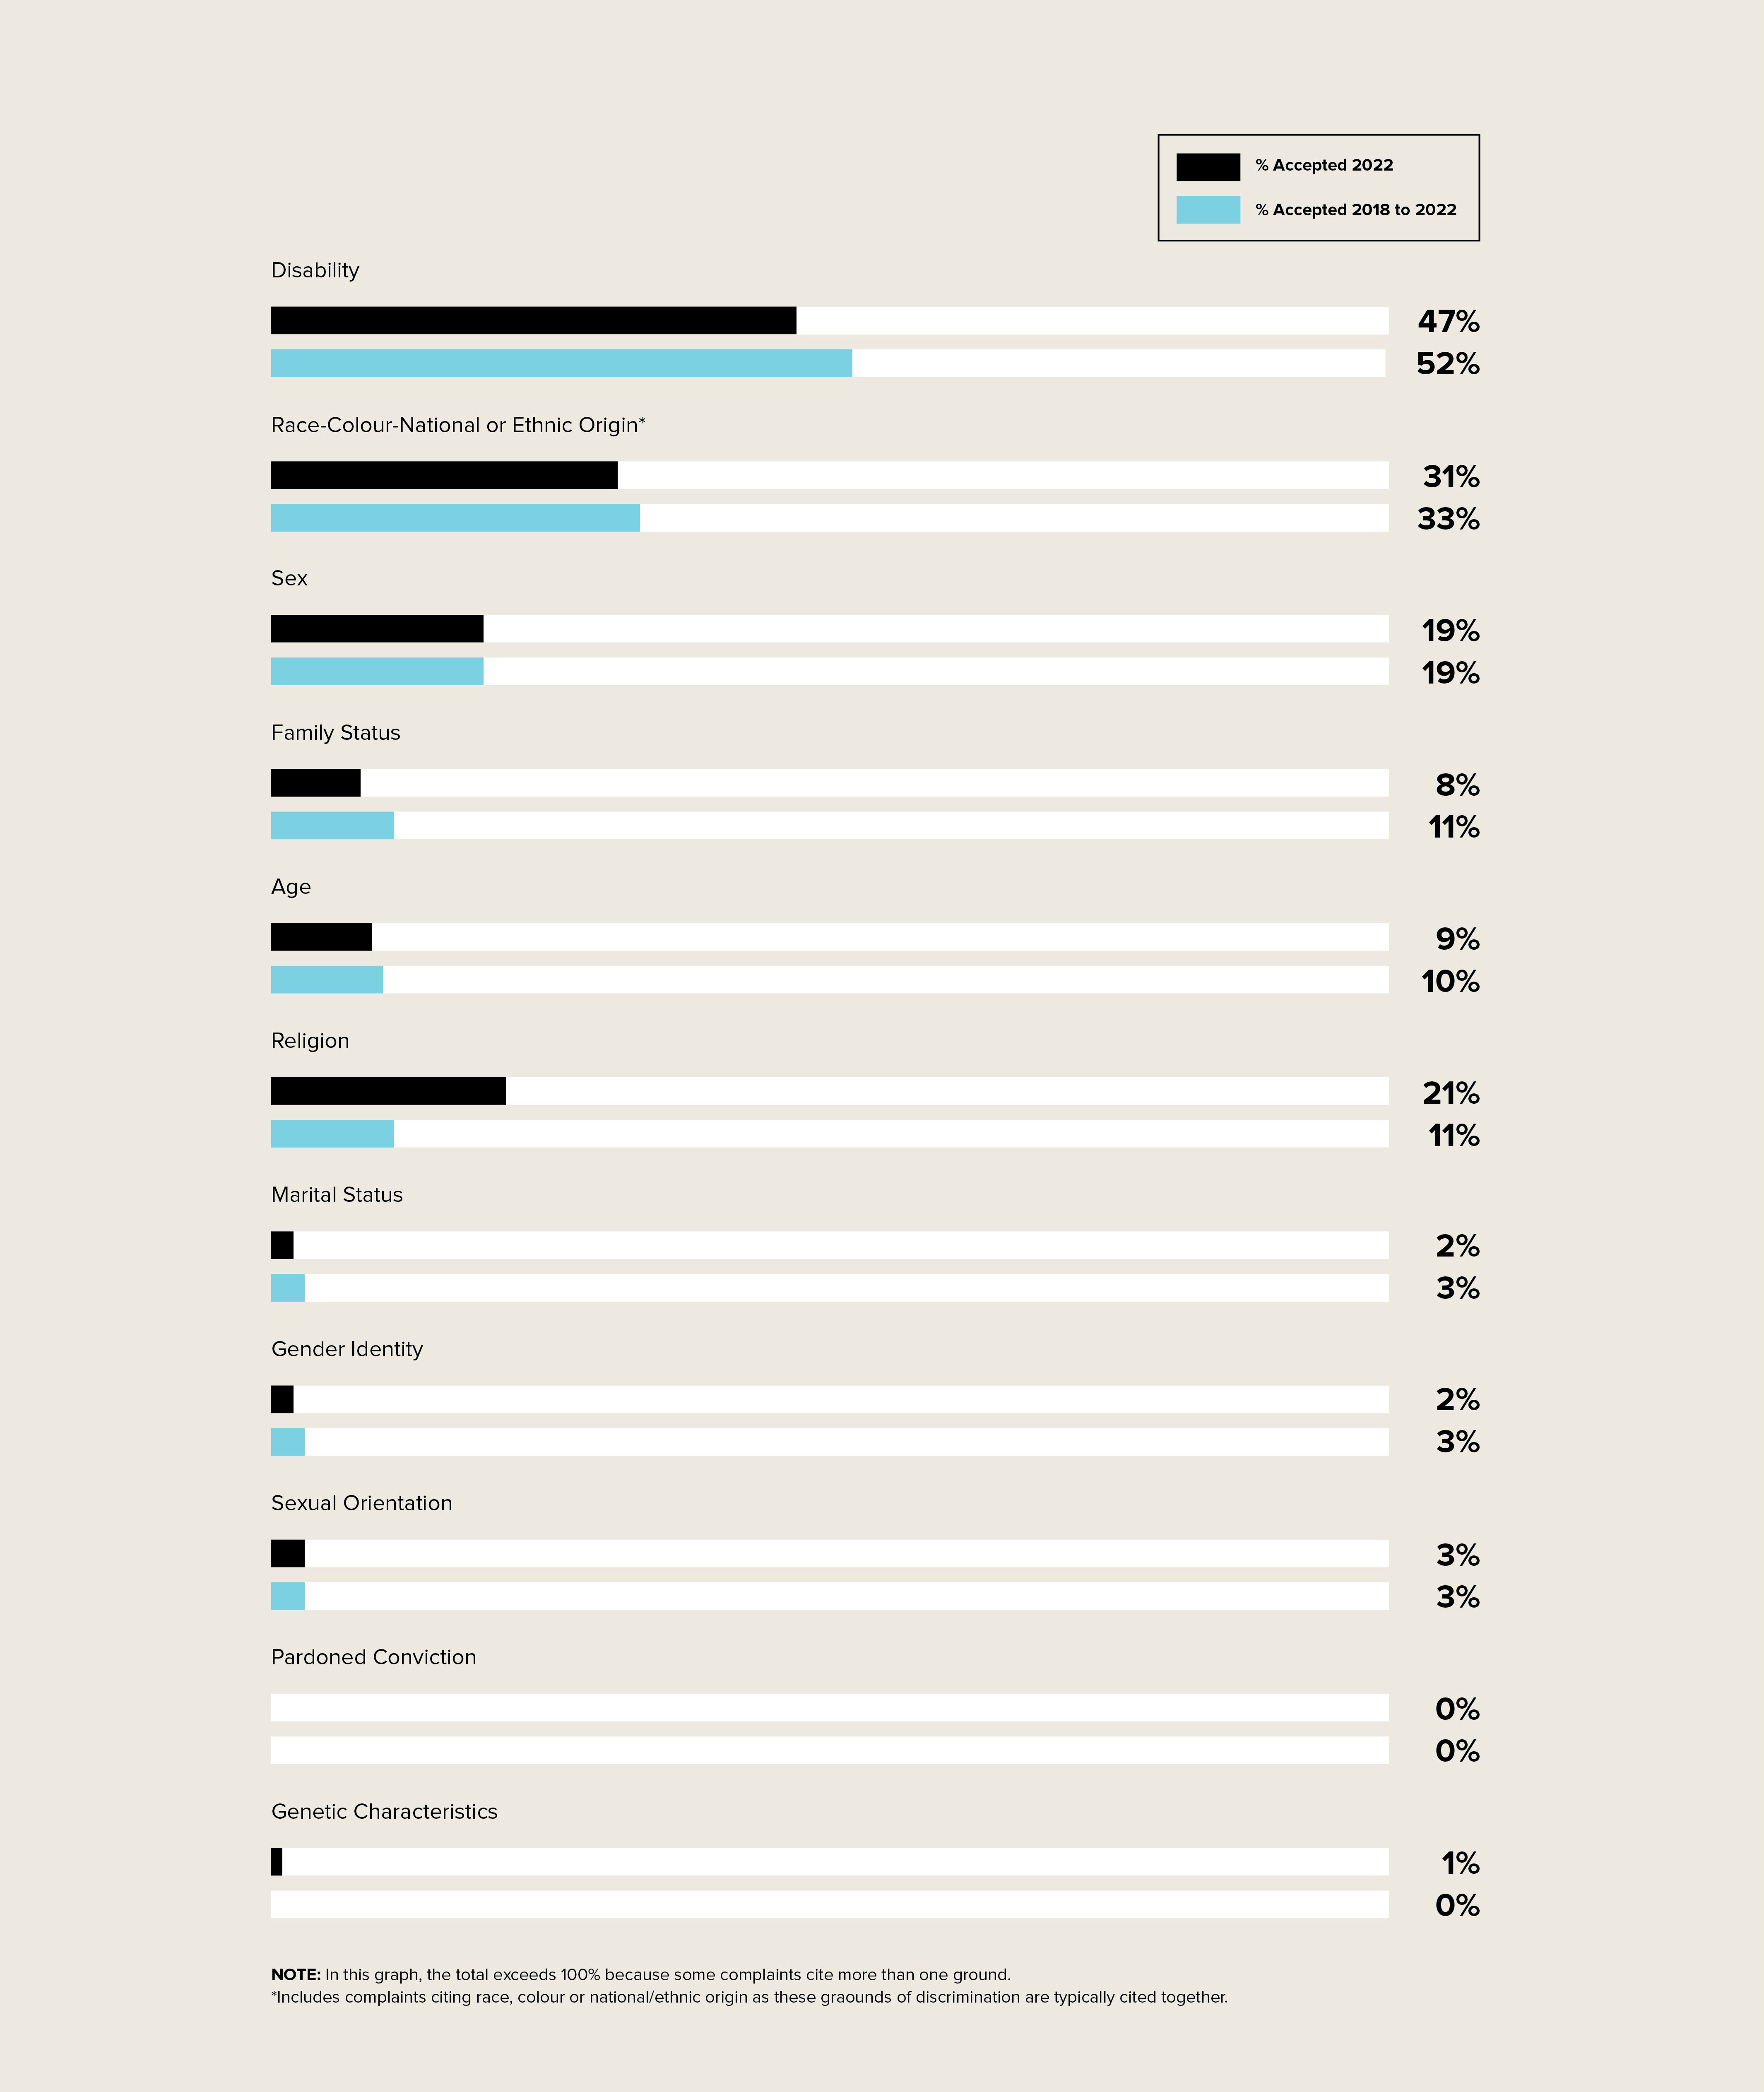
Legend Proportion of accepted complaints by grounds of discrimination - Text version
| Grounds of discrimination | % Accepted 2022 | % Accepted 2018 to 2022 |
|---|---|---|
| Disability | 47% | 52% |
| Race-Colour-National or Ethnic Origintable note * | 31% | 33% |
| Sex | 19% | 19% |
| Family Status | 8% | 11% |
| Age | 9% | 10% |
| Religion | 21% | 11% |
| Marital Status | 2% | 3% |
| Gender Identity | 2% | 3% |
| Sexual Orientation | 3% | 3% |
| Pardoned Conviction | 0% | 0% |
| Genetic Characteristics | 1% | 0% |
| ||
From where did the 2022 complaints originate?
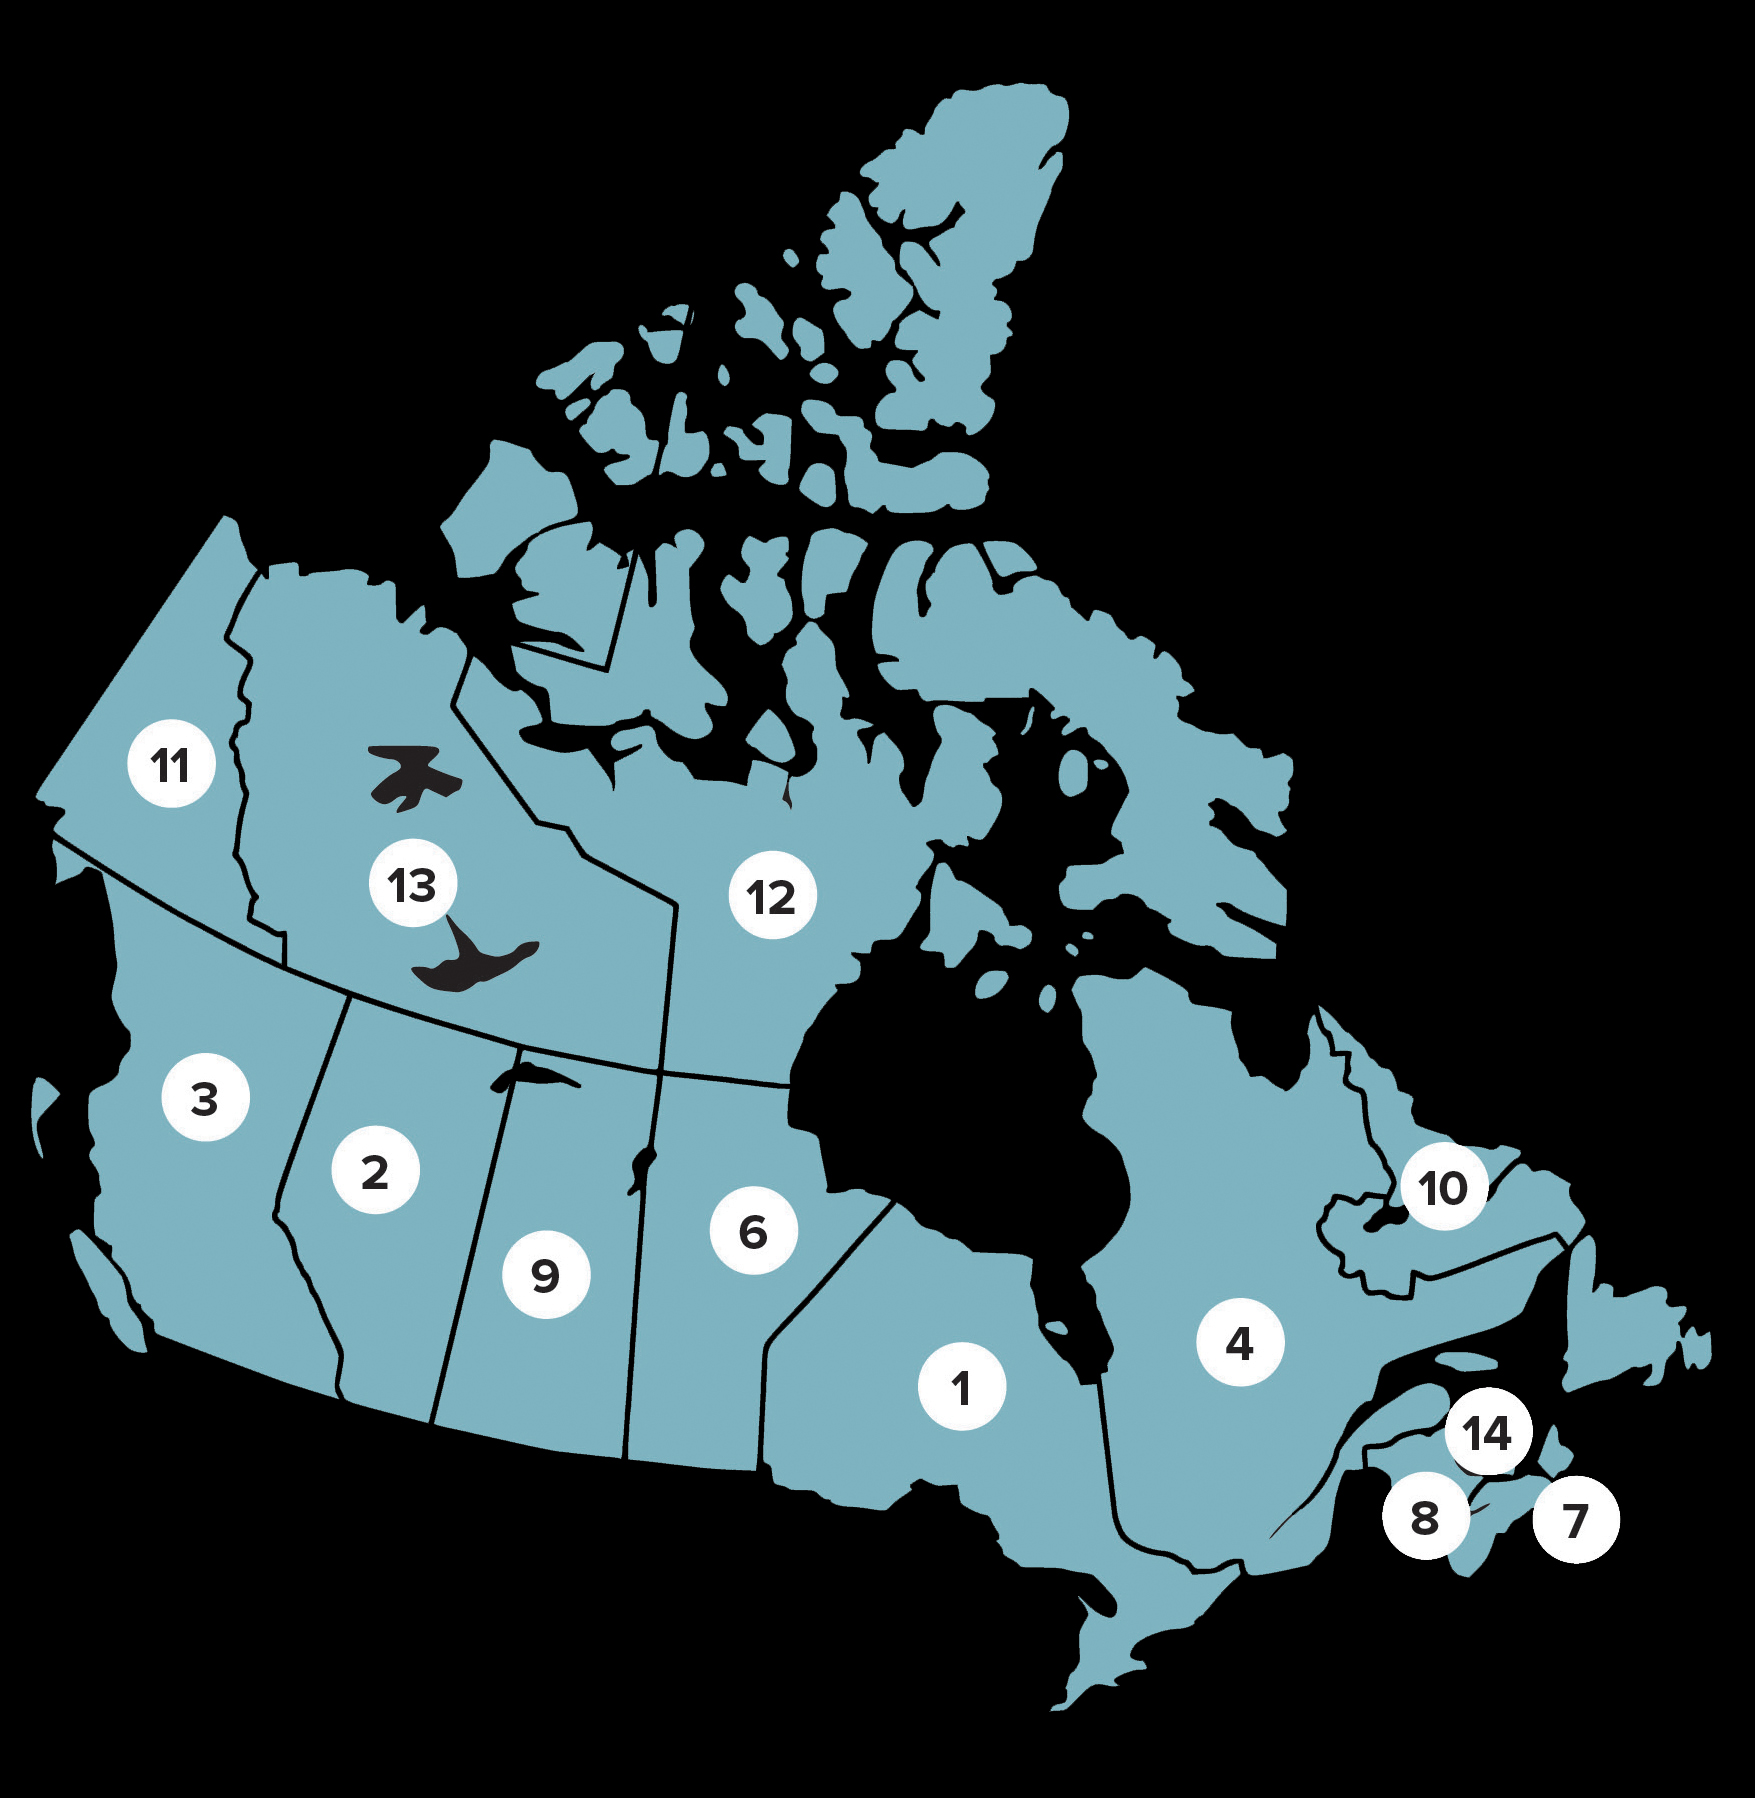
| Legend | Canadian provinces and territories | % complaints accepted |
|---|---|---|
| 1 | Ontario | 40% |
| 2 | Alberta | 16% |
| 3 | British-Columbia | 16% |
| 4 | Quebec | 11% |
| 5 | Other / Multiple / Unspecified | 4% |
| 6 | Manitoba | 4% |
| 7 | Nova Scotia | 3% |
| 8 | New Brunswick | 3% |
| 9 | Saskatchewan | 2% |
| 10 | Newfoundland and Labrador | 2% |
| 11 | Yukon Territories | 1% |
| 12 | Northwest Territories | 0% |
| 13 | Nunavut | 0% |
| 14 | Prince Edward Island | 0% |
| Grand Total | 100% |
What were the 2022 complaints about?
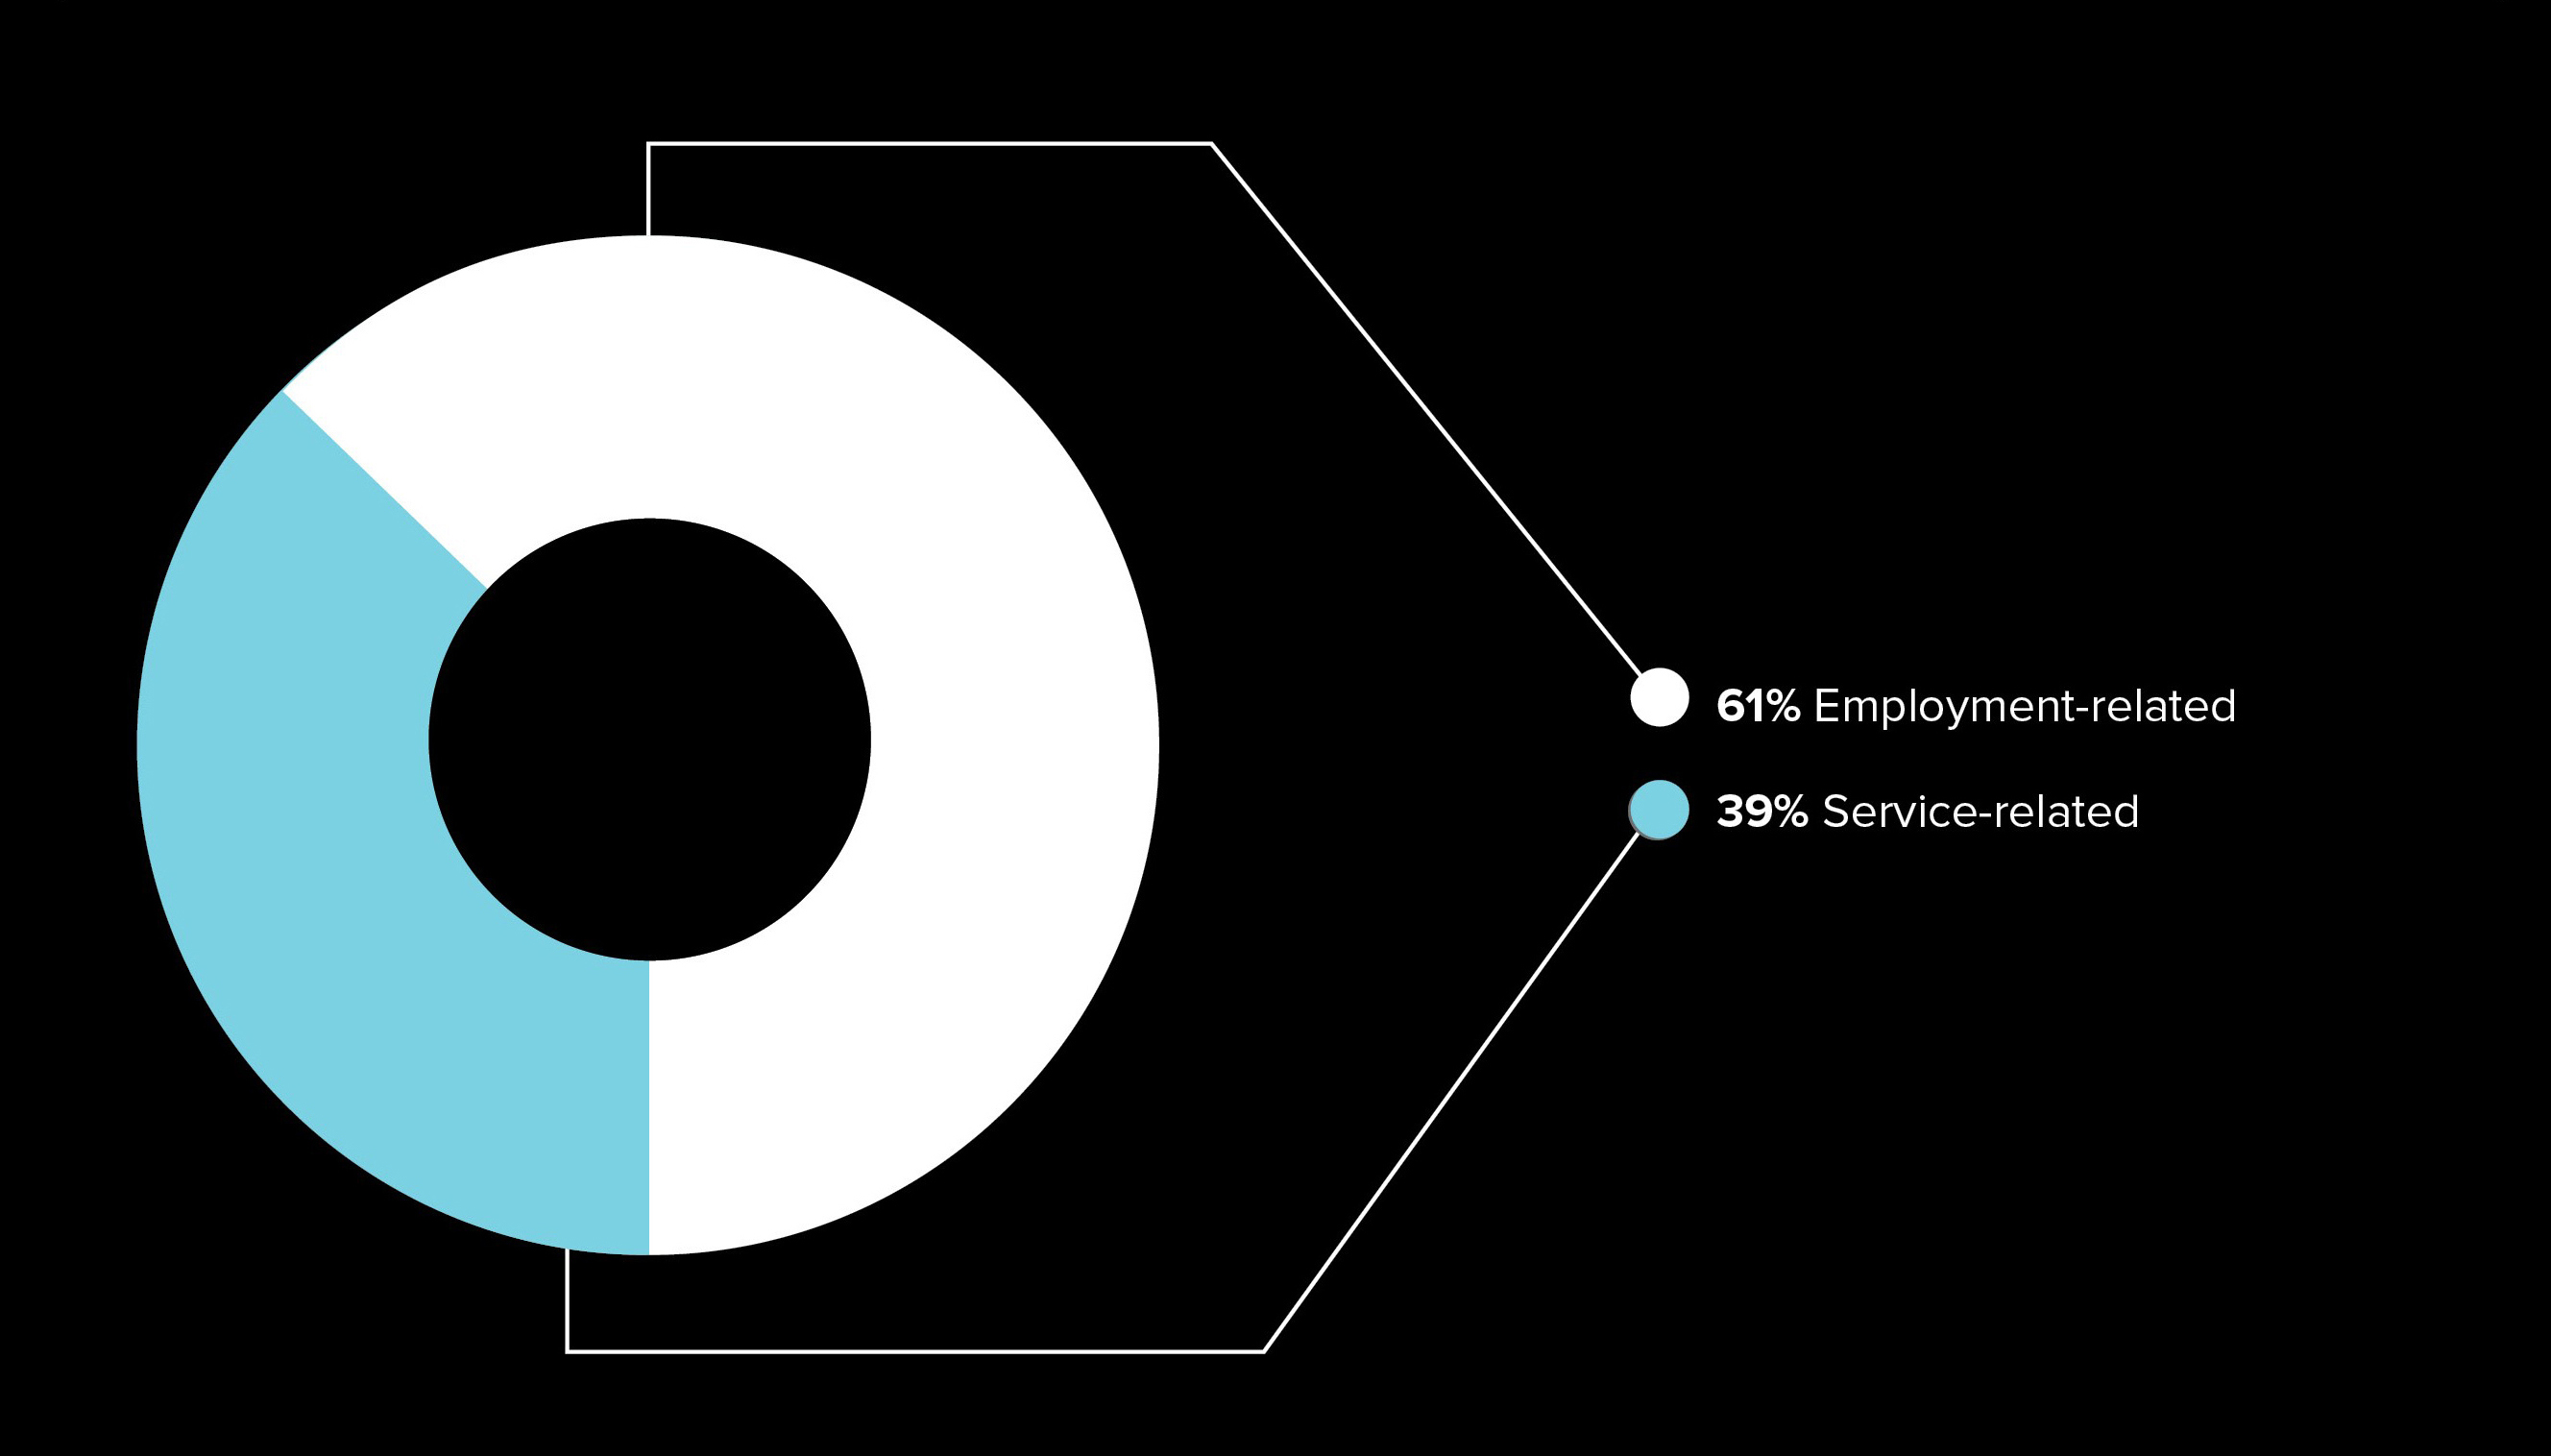
Legend What were the 2022 complaints about - Text version
The pie chart represents:
- 61% Employment-related
- 39% Service-related
Who were the 2022 complaints about?
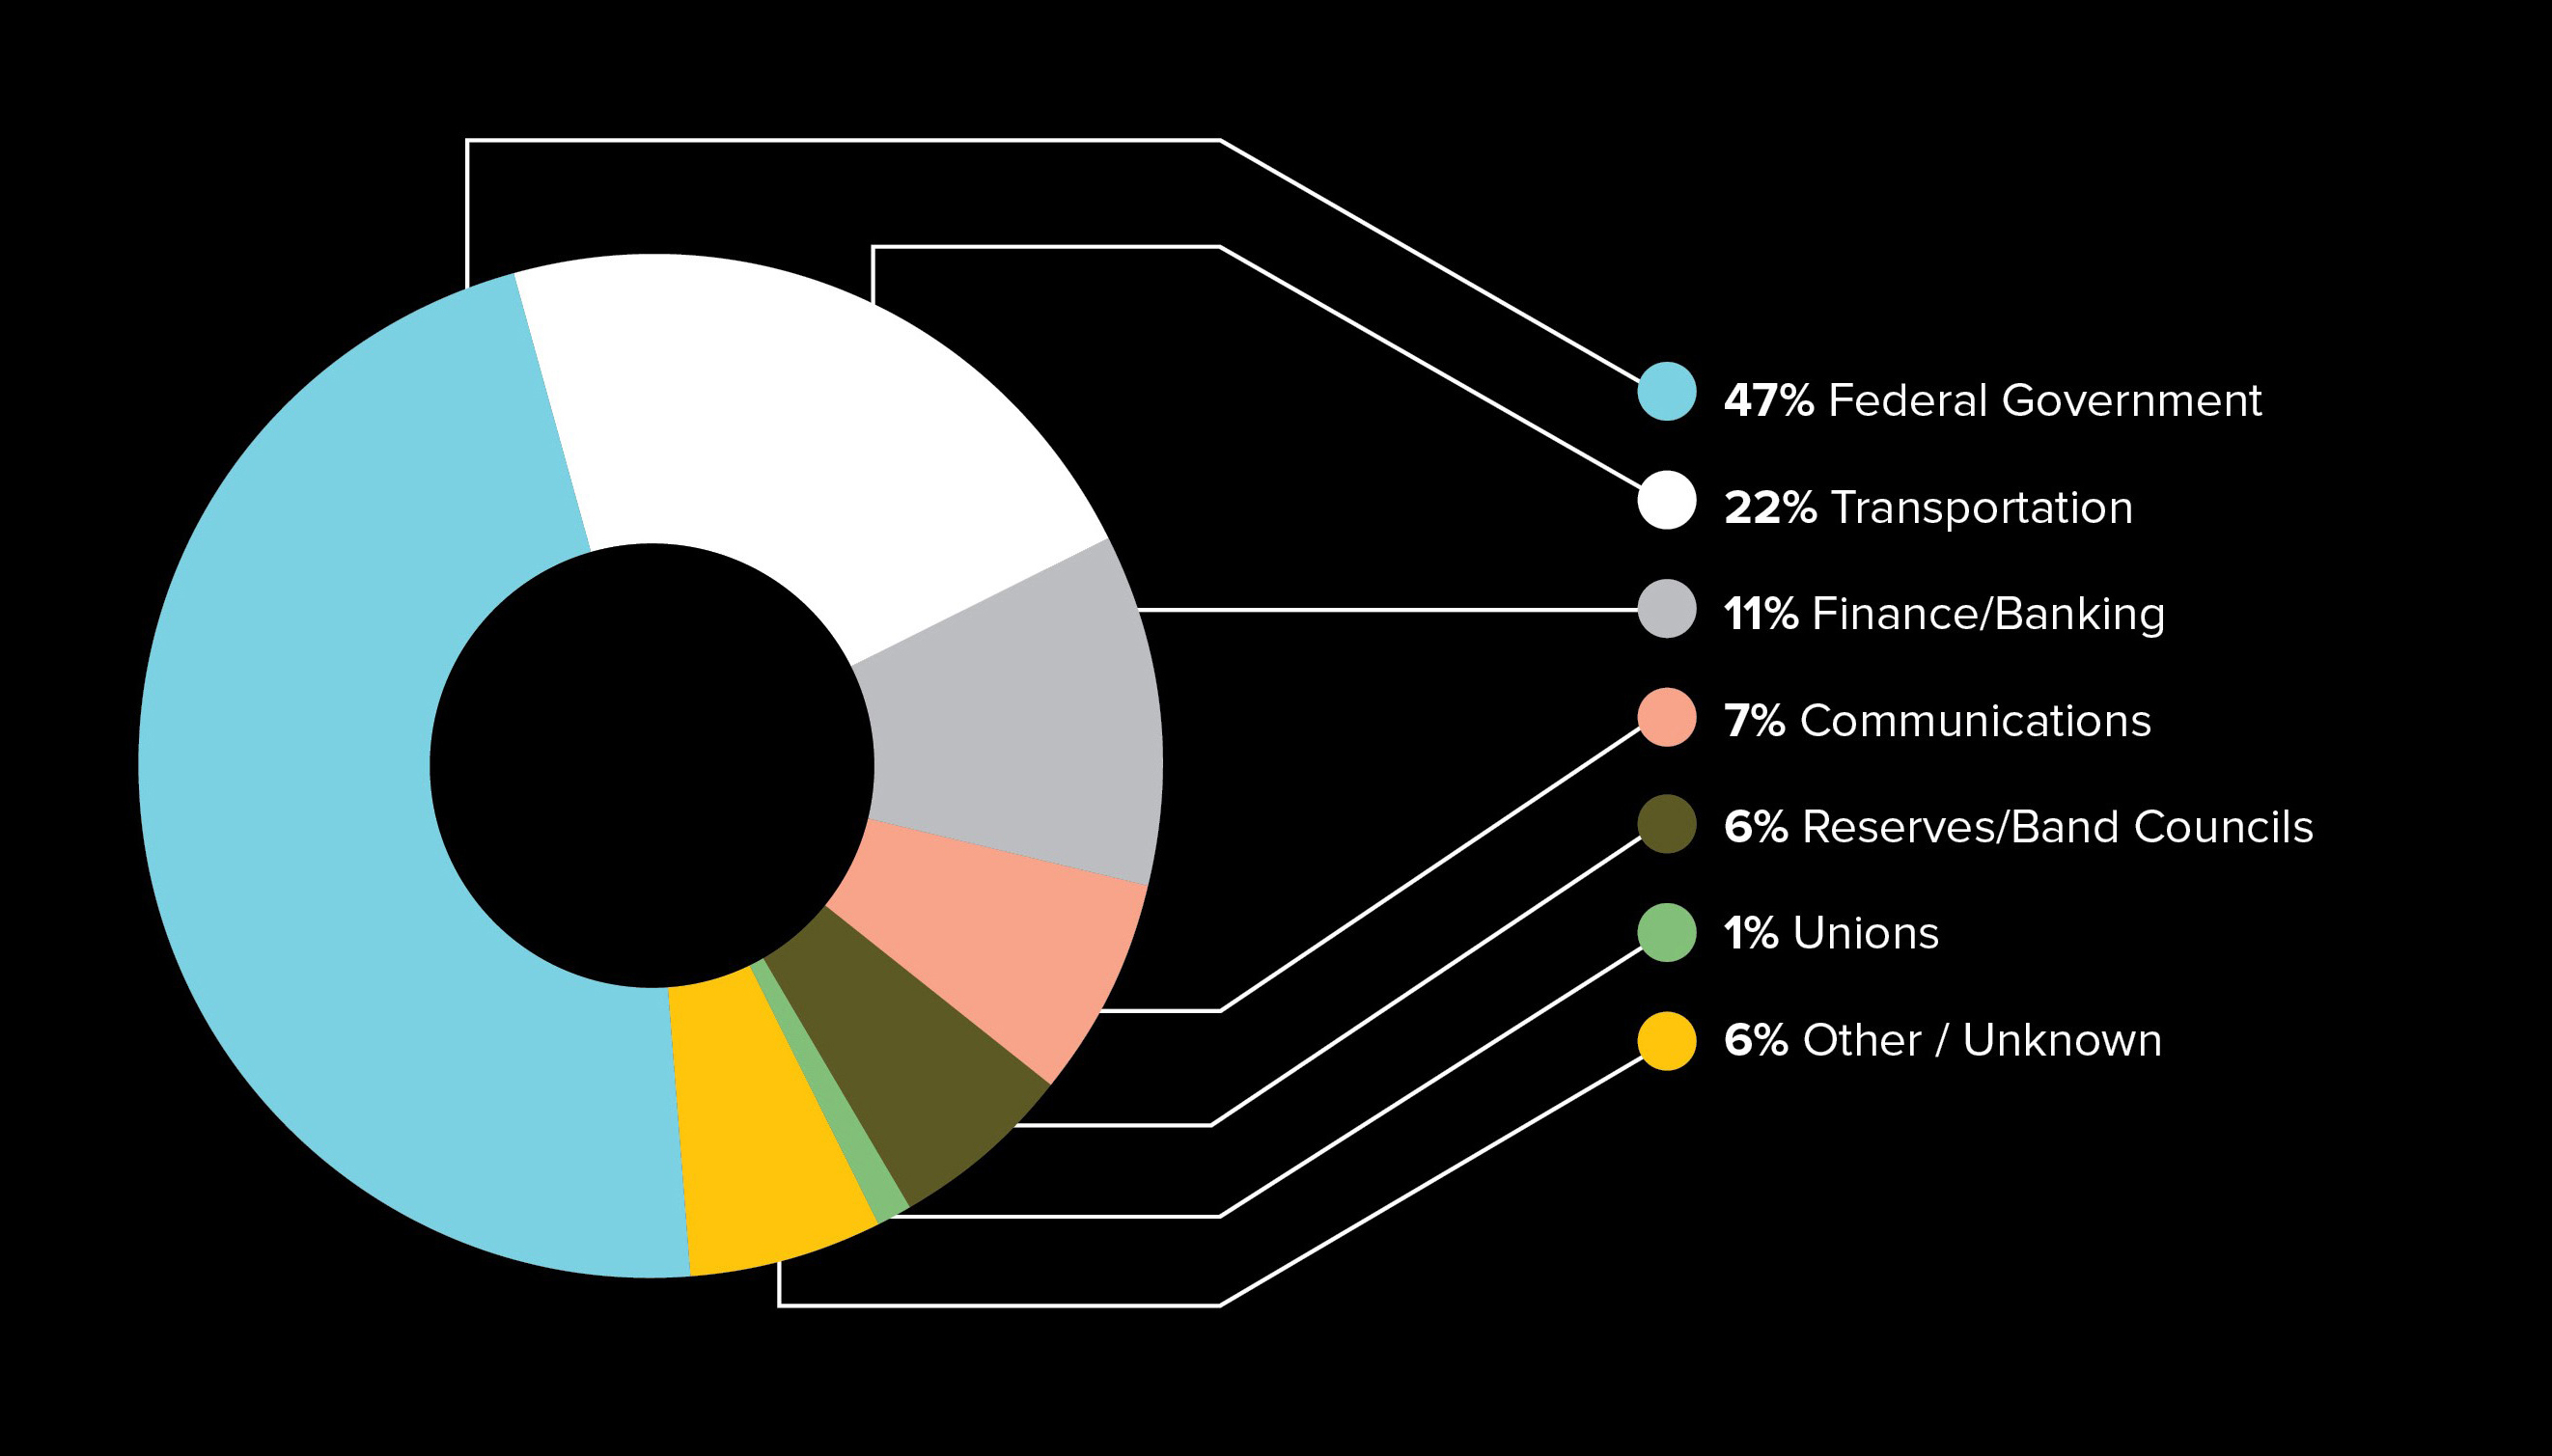
Legend Who were the 2022 complaints about - Text version
The pie chart represents:
- Federal Government: 47%
- Transportation: 22%
- Finance/Banking: 11%
- Communications: 7%
- Reserves/Band Councils: 6%
- Unions: 1%
- Other / Unknown: 6%
Decisions in 2022 by Ground
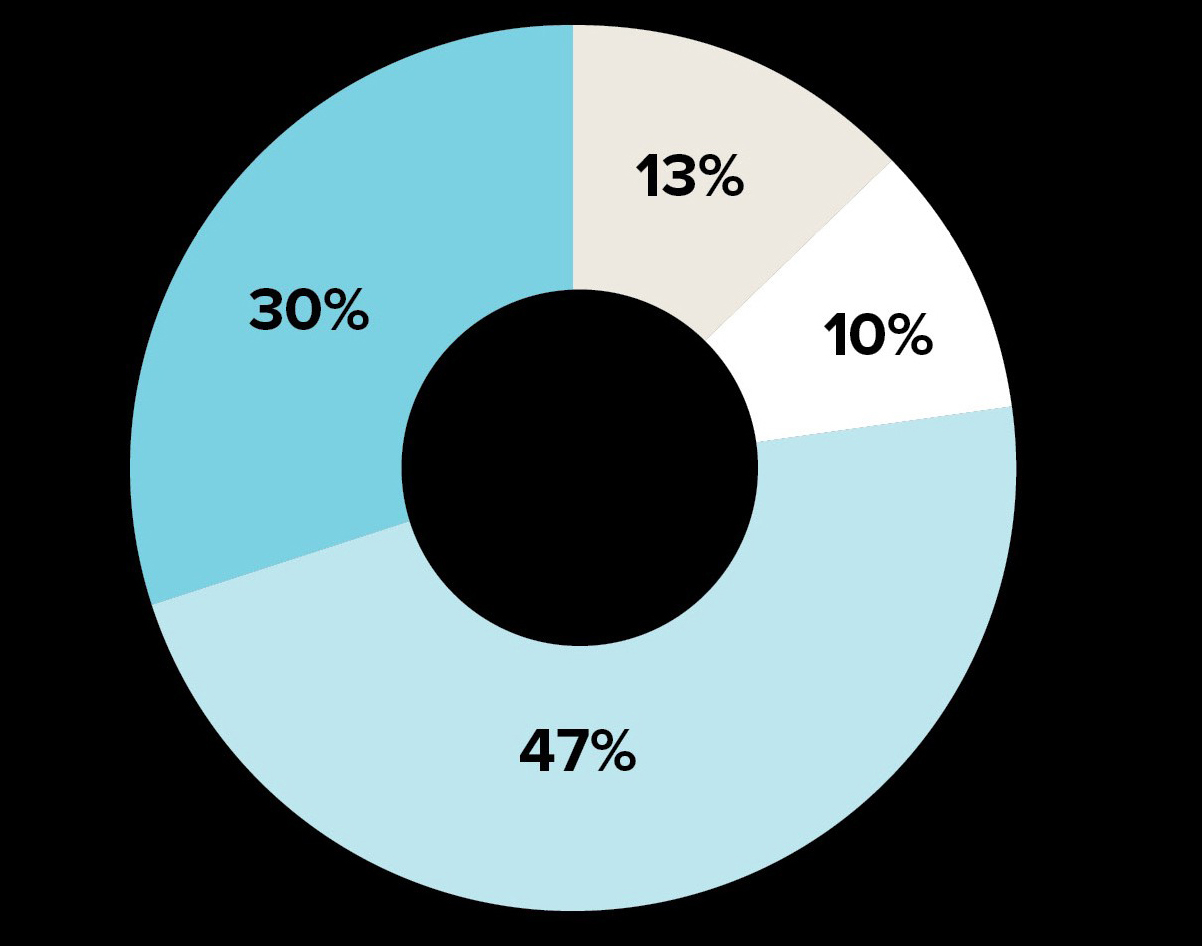
| Decisions | % |
|---|---|
| Dismissed | 13% |
| Referred to Tribunal | 10% |
| Preliminary issues | 47% |
| Settled | 30% |
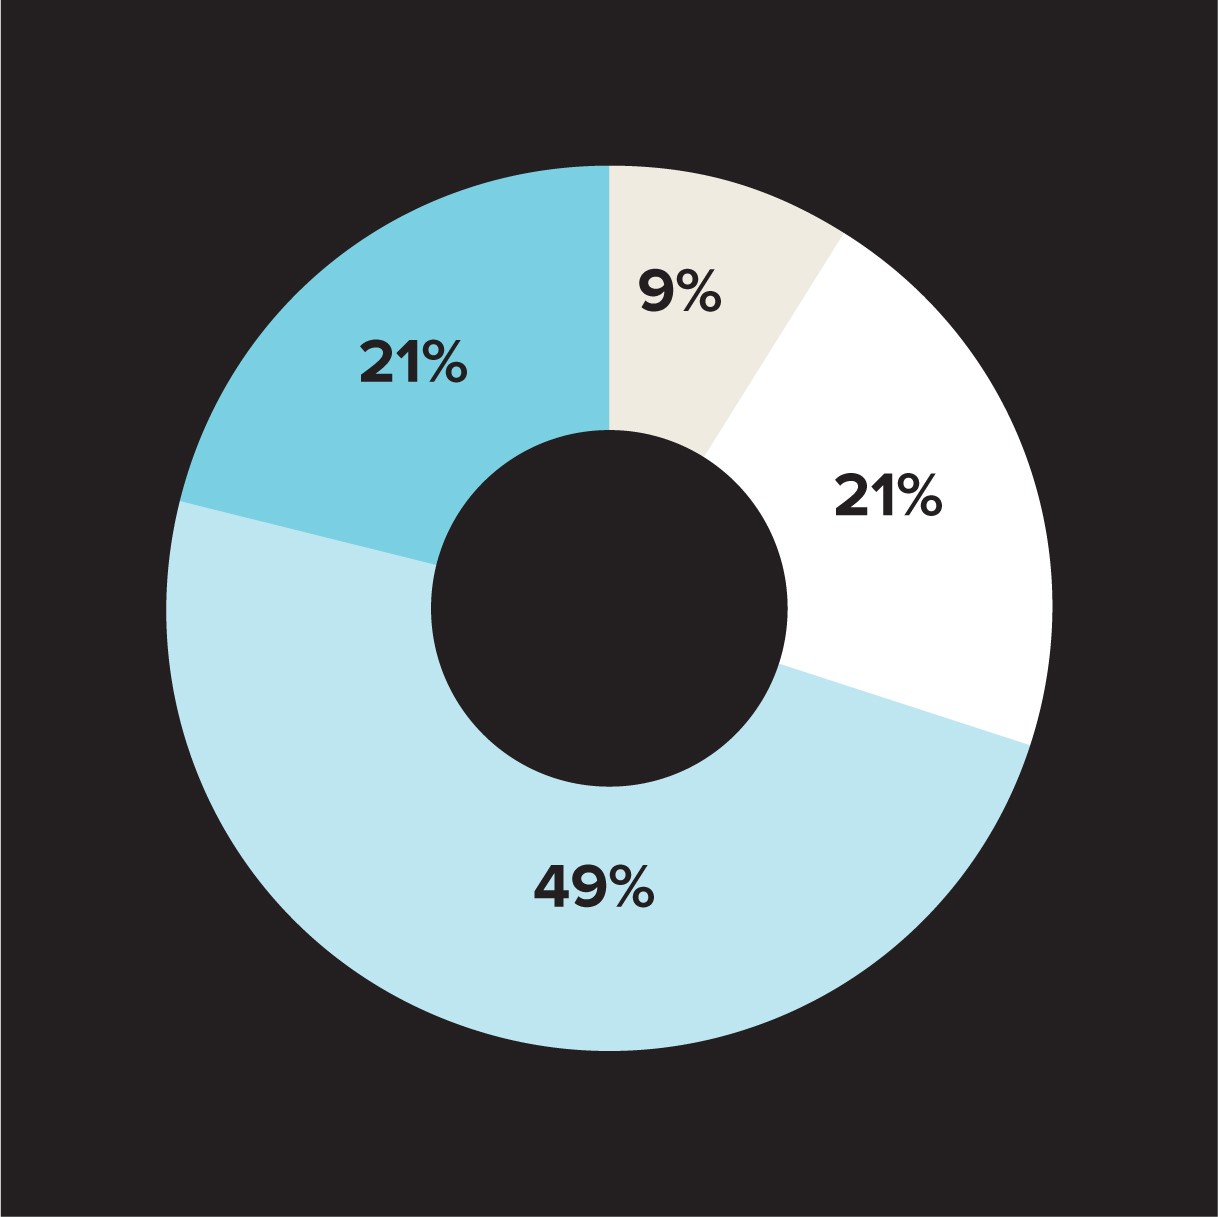
| Decisions | % |
|---|---|
| Dismissed | 9% |
| Referred to Tribunal | 21% |
| Preliminary issues | 49% |
| Settled | 21% |
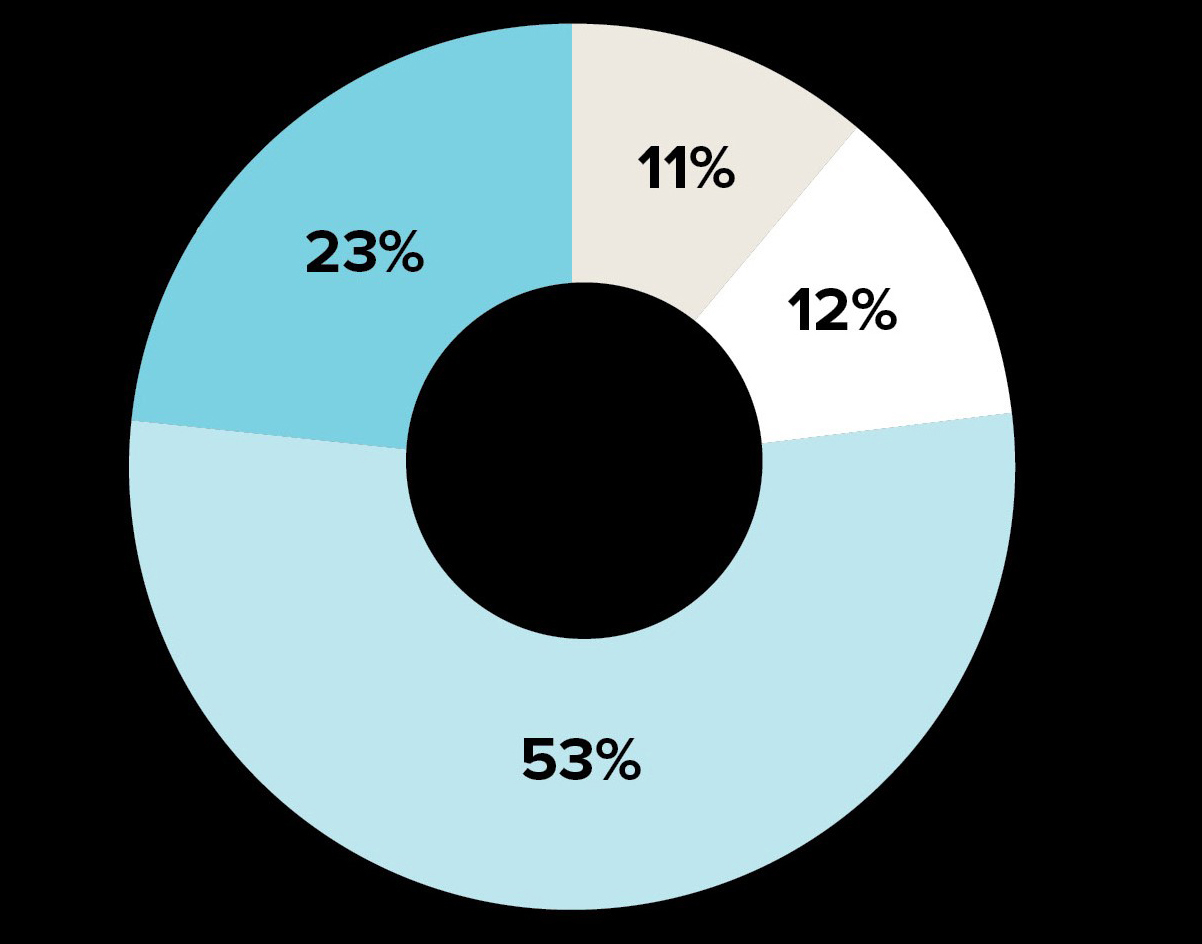
| Decisions | % |
|---|---|
| Dismissed | 11% |
| Referred to Tribunal | 12% |
| Preliminary issues | 53% |
| Settled | 23% |
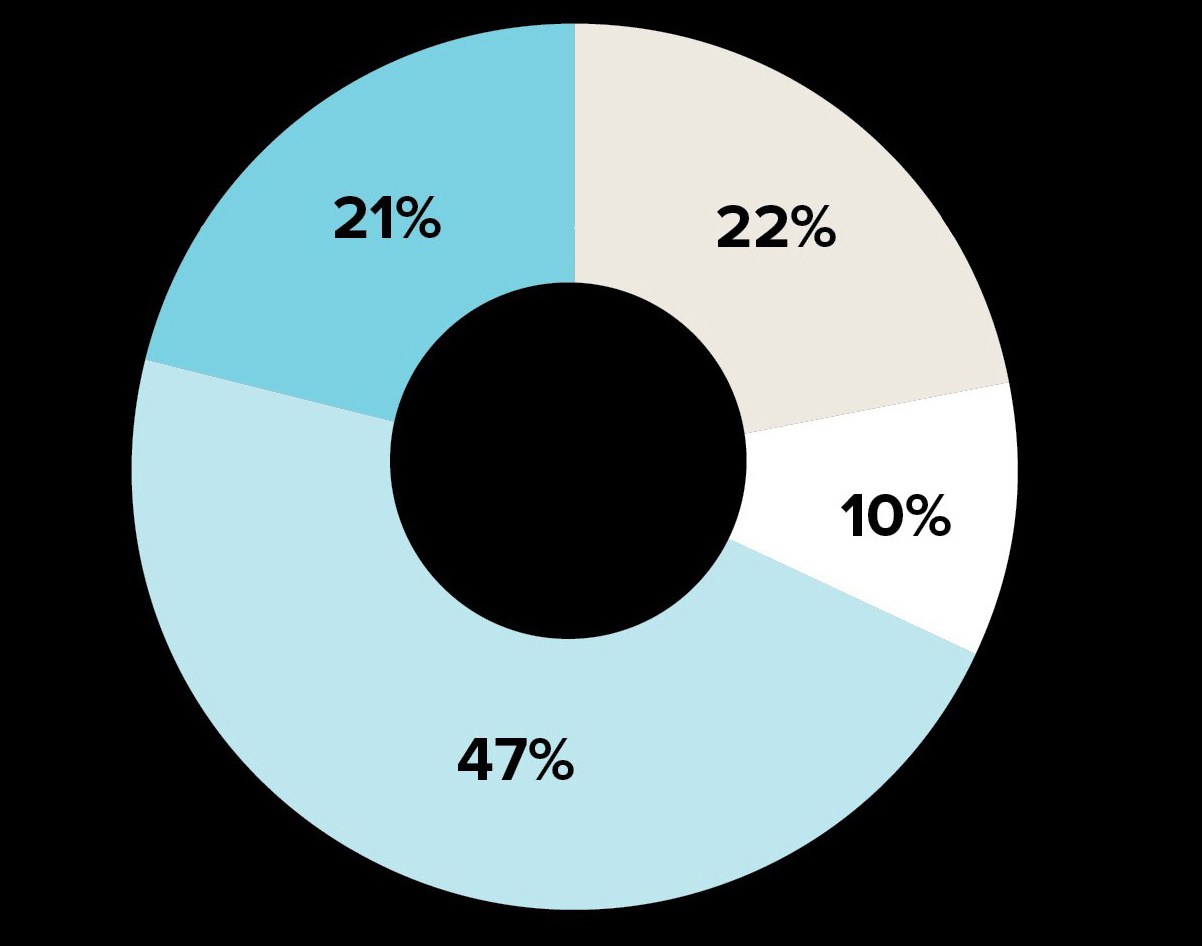
| Decisions | % |
|---|---|
| Dismissed | 22% |
| Referred to Tribunal | 10% |
| Preliminary issues | 47% |
| Settled | 21% |